
Record-Setting Year Rewards Loan Investors and Issuers Alike
By: Andrew N. Sveen, CFA & Christopher Remington
Article published on: October 26, 2021
Boston - As markets move through the fourth quarter, the floating-rate loan asset class appears to be firing on all cylinders. Record-setting investor demand has been met by a comparably historic torrent of loan issuance. It seems that issuers and investors in floating rate loans have been winning.
Technical factors: Market size and trading volume
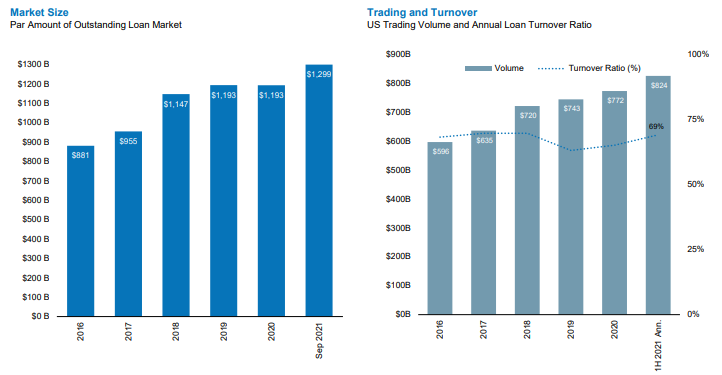
Source: LCD, an offering of S&P Global Market Intelligence, LSTA Trade Data Study. Par amount outstanding as of September 30, 2021. Trading and turnover as of June 30, 2021. Past performance is not a reliable indicator of future results. Data provided is for informational use only. Amount outstanding measures the S&P/LSTA Leveraged Loan Index. Trading and turnover data is sourced from 20 of the largest buy-side and sell-side member institutions of the LSTA. The 1H 2021 trading volume and turnover data is annualized. It is not possible to invest directly in an Index.
Client capital across the institutional and intermediary channels continues to pour in, with the asset class in sharp focus given its position at the four-way intersection of a reflating economy and a conducive credit backdrop, a global dearth of yield in bond markets, investor concerns over rising inflation and interest rates — and, of course, relative value in a sea of low (or even negative) prospective fixed income returns. Loans are checking boxes for investors left and right.
To be sure, the 4.19% yield on the S&P/LSTA Leveraged Loan Index as of September 30, 2021, is both at the lower end of its historic range but also high enough to top nearly all other major areas of domestic bond markets. Better still, loans' unique structure delivers a pure credit product with no material interest-rate duration. In a year that's featured both rising rates and stubbornly "transitory" inflation, loans have helped lead the bond market performance tables, in no small part because traditional rate risk has been minimal for this asset class.
Issuers have been cheering the market dynamics as well. Ongoing demand-surplus conditions have in turn provided companies with ample access to liquidity, fuel for balance sheet recapitalizations, refinancing and a record wave of acquisition-related activity. All that is driving the continued economic recovery, extending maturities for issuers and lowering their borrowing costs too — both of which have been credit positive.
Meanwhile issuers have enjoyed the continued tailwinds of reopening forces, which have driven improving financial performance. Ratings actions have followed suit: Credit upgrades have outpaced downgrades all year. A default rate of just 0.35% and a distress ratio of 0.72% reflect the relatively rosy credit conditions.
At quarter end, the index's average price, average 3-year discounted spread and yield to maturity were 98.6, LIBOR plus 413 basis points and 4.19%, respectively. These are among the building blocks of forward returns.
What's next?
From a technical perspective, we anticipate more of the same firm conditions in the months and quarters ahead. We expect that the healthy credit picture and investors' ongoing search for yield could drive continued institutional and fund channel inflows against a rather unattractive fixed income backdrop. This in turn would serve as a positive feedback loop to the new issue market, where we should see strength in volumes for the balance of the year and into 2022.
On performance, we expect coupon-clipping type return prospects ahead. Spreads and absolute yields may be low by historical comparisons, but they can be easily justified in light of the conducive credit environment and benign default outlook — we've been describing loan valuations as fair. In light of prices broadly near par, we believe returns will remain on an income trajectory.
Bottom line: By construction, this would mean performance less like the appreciation-fueled last 12 months and more like the coupon-oriented returns of the third quarter.
S&P/LSTA Leveraged Loan Index is an unmanaged index of the institutional leveraged loan market.
All investing involves risk, including the risk of loss.
Loans are traded in a private, unregulated inter-dealer or inter-bank resale market and are generally subject to contractual restrictions that must be satisfied before a loan can be bought or sold. These restrictions may impede the strategy's ability to buy or sell loans (thus affecting their liquidity) and may negatively impact the transaction price. It may take longer than seven days for transactions in loans to settle. Due to the possibility of an extended loan settlement process, the strategy may hold cash, sell investments or temporarily borrow from banks or other lenders to meet short- term liquidity needs. Loans may be structured such that they are not securities under securities law, and in the event of fraud or misrepresentation by a borrower, lenders may not have the protection of the anti-fraud provisions of the federal securities laws. Loans are also subject to risks associated with other types of income like high-yield bonds described above. Investments in foreign instruments or currencies can involve greater risk and volatility than U.S. investments because of adverse market, economic, political, regulatory, geopolitical, currency exchange rates or other conditions. Changes in the value of investments entered for hedging purposes may not match those of the position being hedged.
Loading PDF