
Municipal Market Update | January Eases Off Record Rally
Municipal Market Update | January 2024
The municipal bond market started 2024 by reversing some of the gains following a record two-month rally to close out 2023.
After one of the largest rallies in municipal market history, January saw a move higher in yields across the curve. January 2024 issuance was the highest issuance in the month of January since 2017.
Major Municipal Bond Index Returns (%)

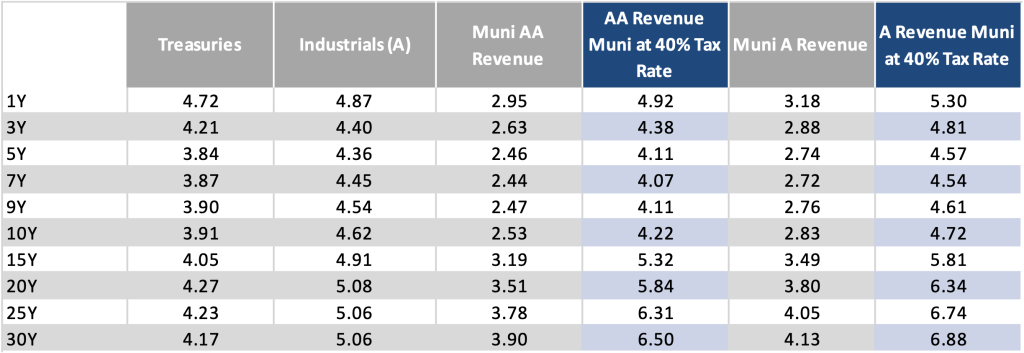
Municipal & Tax Equivalent Yields
Yields across the curve experienced an upward move, however, value continues to persist in the front end and past 10 year calls.
While municipals/Treasuries remain challenging, we continue to see value in high grade municipals versus their longer duration corporate bonds.
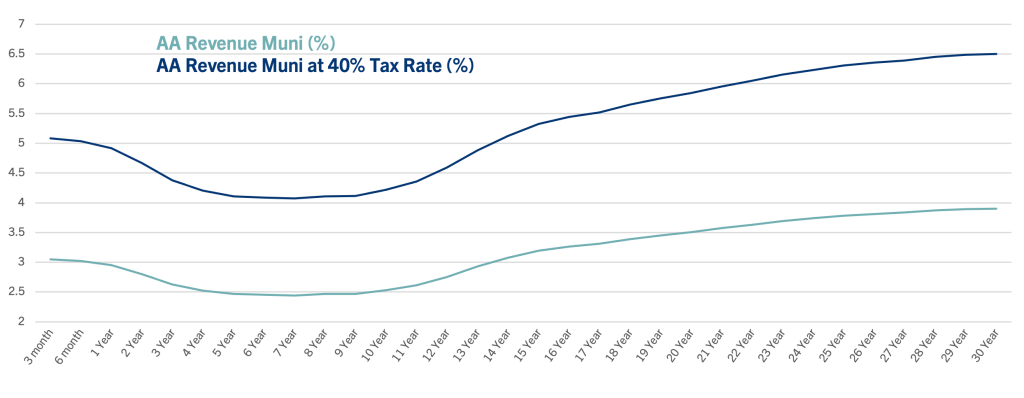
Yield Curve
The ongoing yield curve inversion from 3 to 10 years, as seen below, suggests that a barbell strategy centered around 1 to 2 year and 12+ year maturities is increasingly appealing.
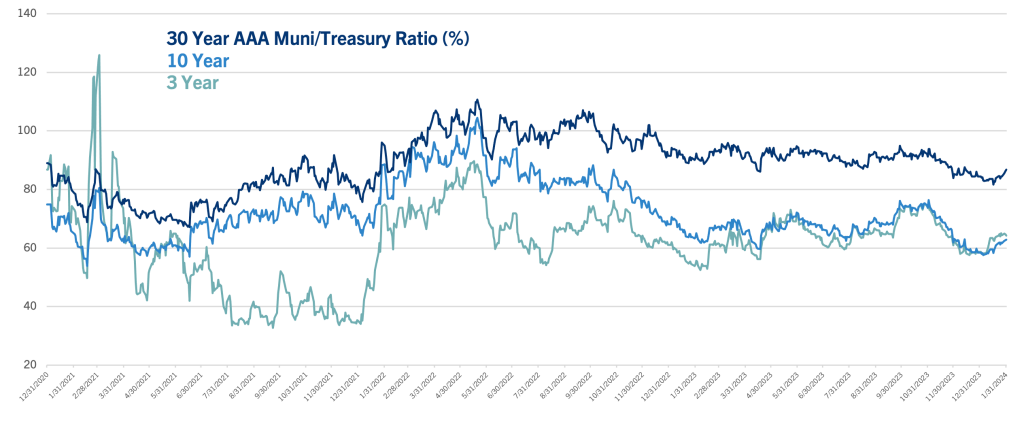
Municipal/Treasury Ratios
The wider spreads between the below data points indicates a steeper municipal curve compared to Treasuries.
Learn more about SBH’s Municipal Strategies .
Source: All data from Bloomberg as of 1/31/23.
The
Bloomberg 1 Year (1-2) Municipal Bond Index
measures the performance of municipal bonds with time to maturity of more than one year and less than two years. The
Bloomberg 5 Year (4-6) Municipal Bond Index
measures the performance of municipal bonds with time to maturity of more than four year and less than six years. The
Bloomberg U.S. 1-15 Year Municipal Bond Index
measures the performance of USD-denominated long-term, tax-exempt bond market with maturities of 1-15 years.
An investor cannot invest directly in an index.
The
Bloomberg Taxable U.S. Aggregate Bond Index
is a broad-based fixed-income index used by bond traders.
Yield to Worst
is the lowest potential bond yield received without the issuer defaulting; it assumes the worst-case scenario, or earliest redemption possible under terms of the bond.
Duration
is a calculation of the average life of a bond (or portfolio of bonds) that is a useful measure of the bond’s price sensitivity to interest rate changes. The higher the duration number, the greater the risk and reward potential of the bond.
A basis point is a standard measure for interest rates and other percentages in finance. This update provides an overview of certain broad-based Fixed Income benchmarks and does not include performance of the Segall Bryant & Hamill Fixed Income styles. Past performance cannot guarantee future results. All investments involve risk, including the possible loss of capital. All opinions expressed in this material are solely the opinions of Segall Bryant & Hamill. You should not treat any opinion expressed as a specific inducement to make a particular investment or follow a particular strategy, but only as an expression of the manager’s opinions. The opinions expressed are based upon information the manager considers reliable, but completeness or accuracy is not warranted, and it should not be relied upon as such. Market conditions are subject to change at any time, and no forecast can be guaranteed. Any and all information perceived from this material does not constitute financial, legal, tax or other professional advice and is not intended as a substitute for consultation with a qualified professional. The manager’s statements and opinions are subject to change without notice, and Segall Bryant & Hamill is not under any obligation to update or correct any information provided in this material.