
SP 500 Earnings: Long-Term SP 500 Earnings Trends along with Market Returns
Over the years, one data point I’ve noticed is that many SP 500 valuation models use a long-run SP 500 EPS growth metric of 7% to estimate fair value on the benchmark.
- During the 1980’s and 1990’s, the SP 500 EPS growth averaged roughly 18% per year.
- The 2000’s – the decade from 2000 to 2009 – saw the SP 500 average about 2% – 3% annual EPS growth for the decade.
- 2010 to 2019 saw the SP 500 EPS growth average about 11% per year.
- 2020 through 2024 (which obviously includes COVID and the pandemic) has seen SP 500 EPS growth average 10% per year over the last five years.
Is 7% the appropriate growth rate ? 7% is probably a few percent too conservative, but that’s the way most valuation models work anyway.
If you look at SP 500 returns over these longer time periods, you’ll see the return on the SP 500 benchmark, roughly mirrors the longer-term growth (or decline) of SP 500 earnings.
Shocker, no ?
The 2000 – 2009 decade was the real tell for me in that as it was the worst decade for stock returns since the 1930’s with the average annual return for the SP 500 for the 2000 – 2009 decade being 1.5% per year, while SP 500 earnings growth for the decade was 2% – 3% per year, on average. It was an entire decade of “PE contraction”, with the worst years being 2007, 2008 and 2009, in terms of y-o-y SP 500 earnings decline. All three calendar years saw negative y-o-y EPS growth for the SP 500.
Like the 3rd bullet point notes above, SP 500 EPS growth averaged about 11% per year from 2010 to 2019, while the SP 500 returned (on average) 14% for the same decade.
2020 to 2024 has seen more PE expansion as the SP has averaged a 16% return for the 5 years, while SP 500 EPS growth has averaged 10% per year.
In 2025, readers and investors could probably expect a positive year of SP 500 returns, but I’d guess it’s going to be less than 10%.
We are likely to see a year of “PE compression” in 2025 given the last 2 years and the decade-to-date average return versus the EPS growth.
Sector data:
One data series that caught my eye Sunday, was comparing the tech sector’s EPS growth for 2024 (by quarter), from the first day of the quarter through the last day. Put another way, was growth stronger or weaker as quarterly earnings unfolded ?
- Q1 ’24: Tech was expected to grow +20.9% y-o-y to start Q1 ’24, but ended up growing 27% for Q1 ’24, for a 610 bp improvement over the quarter;
- Q2 ’24: Tech was expected to grow +16.9%, but ended up growing +21.3% for a 440 bp improvement through the quarter;
- Q3 ’24: Tech was expected to grow +15.1%, while actual growth was +19.5%, also for a 440 bp improvement through the quarter;
- Q4 ’24: With two weeks left, Tech started the quarter expecting +15.3% growth, while actual growth as of Friday, March 14th, has been +19.8%, for a 450 bp improvement throughout the quarter.
For the decade-to-date, the tech has averaged 16.8% growth from Q1 ’20 through Q4 ’23.
The last 4 quarters or basically 2024 have seen tech grow faster than “average” through the first two quarters of ’24, and then slower than average through the last two quarters of ’24.
This blog started religiously tracking sector growth rates starting in Q4, 2011. From Q4, 2011, through Q4 ’23, the technology sector has averaged +12.6% growth per quarter over those 51 quarters.
In 2024 alone, with 2 weeks left in Q4 ’24 reporting, the tech sector has averaged 21% y-o-y growth in ’24.
Peak tech earnings growth ? Inquiring minds want to know.
Want to read something more surprising: Financial sector EPS growth was even stronger than the tech sector’s growth.
From q4 ’11, through Q4 ’23, the financial sector averaged +15.8% y-o-y growth.
In 2024, financials were even stronger: for the 4 quarters of ’24, financials have averaged +18.1% y-o-y growth, with two weeks left in the 4th quarter’s releases.
If not peak, perhaps peak financial EPS growth ?
The two arte typically tied at the hip. The 1980’s – 1990’s secular bull market saw technology and the financial sector as the two leadership sectors – the so-called “generals” – for that 18-year period.
Growth revisions – How similar is Q1 ’25 to Q1 ’24 a year ago ?
Better than writing about it, this blog will show readers:
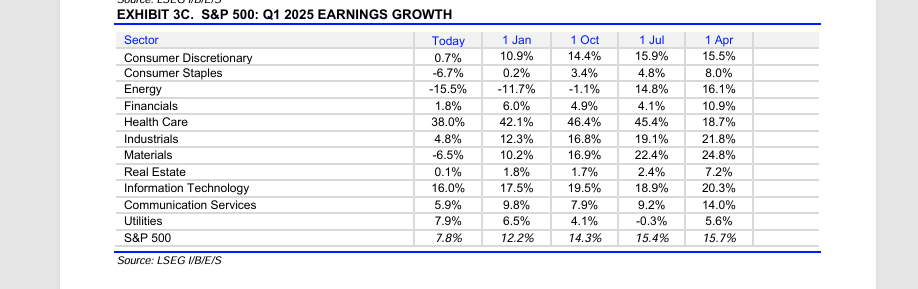
Click on this table from LSEG IBES.
Q1 ’25’s expected growth rate for SP 500 EPS has fallen 440 basis points from January 1, to March 14th, 2025.
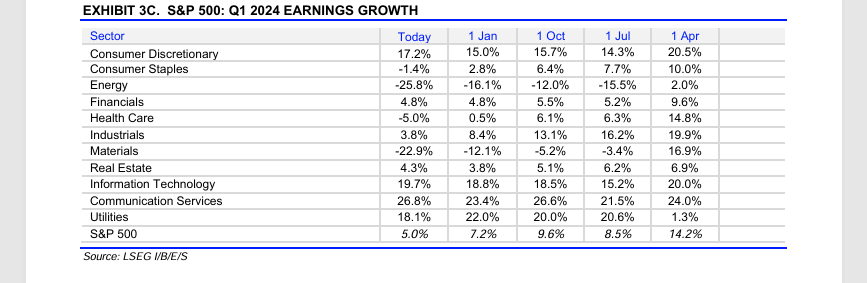
The above table is almost exactly one year ago, and shows the Q1 ’24 revisions for the first 10 weeks of Q1 ’24.
Although the overall expected EPS growth for the SP 500 back in Q1 ’24 is still mid-single-digits, the erosion over the 90 days, wasn’t too bad, but we saw an almost 50% reduction in growth estimates over the 6 month or 180 day period from October ’23.
In this blog post in late February ’25, I tried to show how first quarter’s can be similar after prior year periods of solid returns, as analysts become more cautious.
For expected Q1 ’25, despite how the Mag 7 is trading, the tech sector EPS growth is expected at 16%, down from 17.5% as of January 1 ’25, which isn’t too onerous. In other words given how Apple, Microsoft, the semi’s, Nvidia and others have traded, there doesn’t seem to be a lot of downward pressure on the tech sector expected growth rate. Consumer discretionary and financials have lost quite a bit in the last 10 weeks, in terms of expected growth rates.
Summary / conclusion:
At some point in the last 5 years, some of “tech” was realigned with other sectors: it could have been when “telco” was re-worked and became the “communication services” sector, and communication services began to hold META, Alphabet, and even Netflix now.
That’s what makes me nervous about comparisons over different time periods. Same with financials, which I thought included REIT’s at one point, but that may now be in the newer real estate sector (newer to this decade anyway), so I hope readers understand. Financials were re-worked and re-constituted in the latter part of the 2010 to 2019 decade.
What’s remarkable is that decade returns for the SP 500, seem to mirror (or be very similar) to decade SP EPS growth.
I do expect – and take it with a grain of salt – that SP 500 EPS growth should be better than 10% in 2025, but the benchmark won’t necessarily perform that well.
Take it with a grain of salt.
If readers are interested in other sector info, let me know.
None of this is advice or a recommendation, but only an opinion. Past performance is no guarantee of future results. Investing can and does involve the loss of principal, even for short periods of time. None of this information may be updated, and if updated, may not be done in a timely fashion. All EPS growth is typically from LSEG, while market return data is from Morningstar.
Thanks for reading.