
Stock Market Performance by President (in Charts)
As the next U.S. presidential election nears, investors may be wondering what the implications are for their investments. How will the stock market react if the incumbent (President Trump) wins? What will markets do if the current Republican administration is replaced by a Democratic one? How does the stock market...
The post Stock Market Performance by President (in Charts) appeared first on Darrow Wealth Managment .
As the next U.S. presidential election nears, investors may be wondering what the implications are for their investments. How will the stock market react if the incumbent (President Trump) wins? What will markets do if the current Republican administration is replaced by a Democratic one? How does the stock market perform when Republicans or Democrats have control of Congress vs when it’s mixed? Although volatility is often heightened during an election year, historically, returns tend to be higher as well. And over the long-term, the stock market has performed well under all types of presidential administrations. Here are several charts to illustrate the stock market performance by president.
U.S. Stock market performance by president (S&P 500)
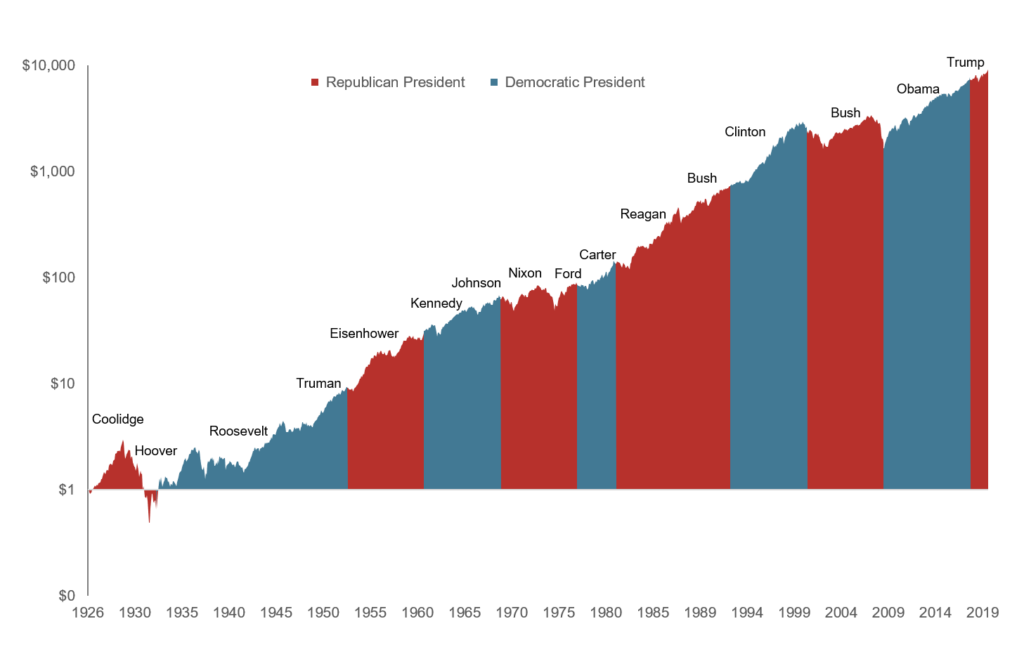
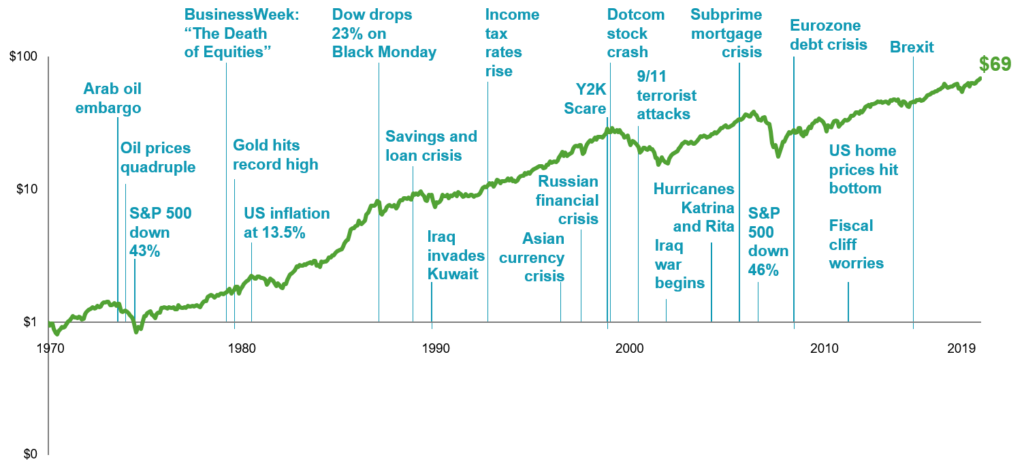
Growth of a Dollar Invested in the S&P 500
Under both Democratic and Republican presidents, the stock market has generally performed well with an upward trajectory over the long-term. It’s important to keep in mind the myriad of other factors that impact stock market performance aside from who is elected as president of the United States. For example, the September 11th terrorist attacks and the 2008 Great Financial Crisis occurred under President G.W. Bush.
President Obama’s term, starting in 2009, began when stock market valuations were near the bottom and as is well documented now, the stock market went on to its longest bull market in history. The impact of policy here can be debated, but the key takeaway is the limited control any administration has and the impact unanticipated and uncontrollable events can have for or against the stock market.
Source: Dimensional Fund Advisors
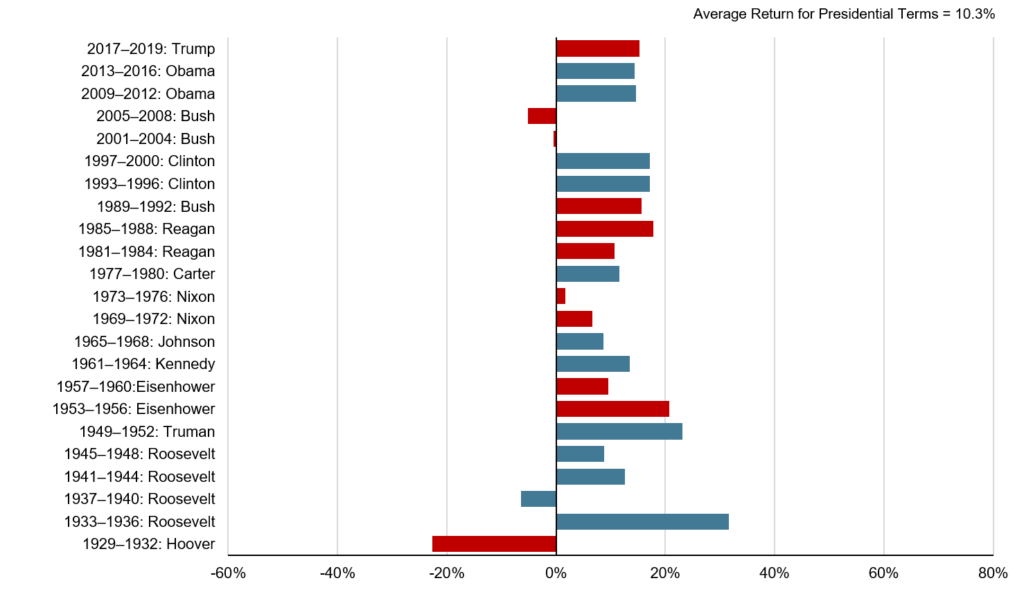
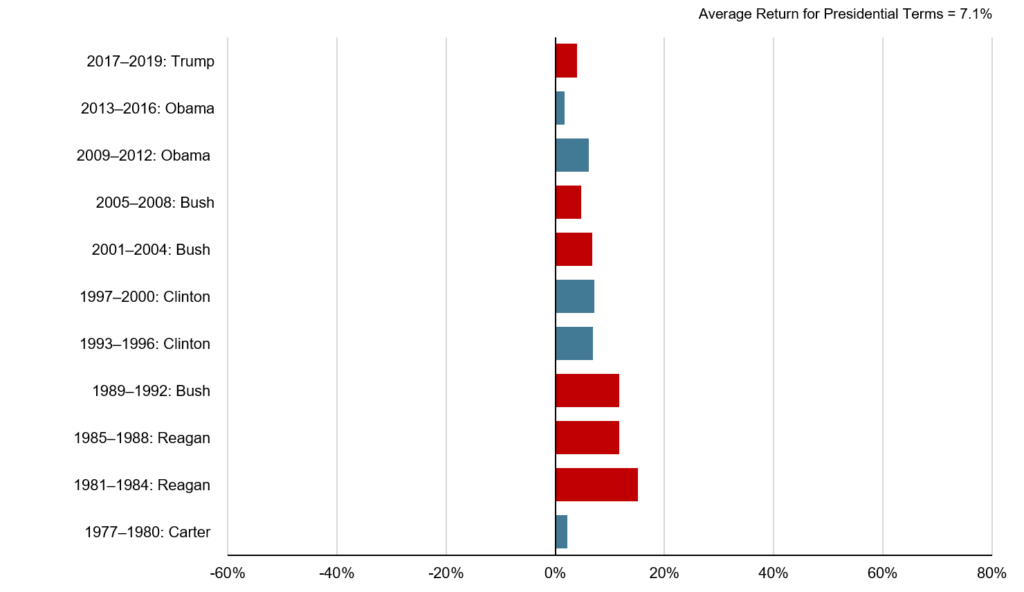
Annualized U.S. stock market returns during presidential terms
S&P 500 Index
Since 1929, only four presidential terms have experienced negative returns for the S&P 500 on an annualized basis. The average annualized return for a president’s term is over 10%.
Source: Dimensional Fund Advisors
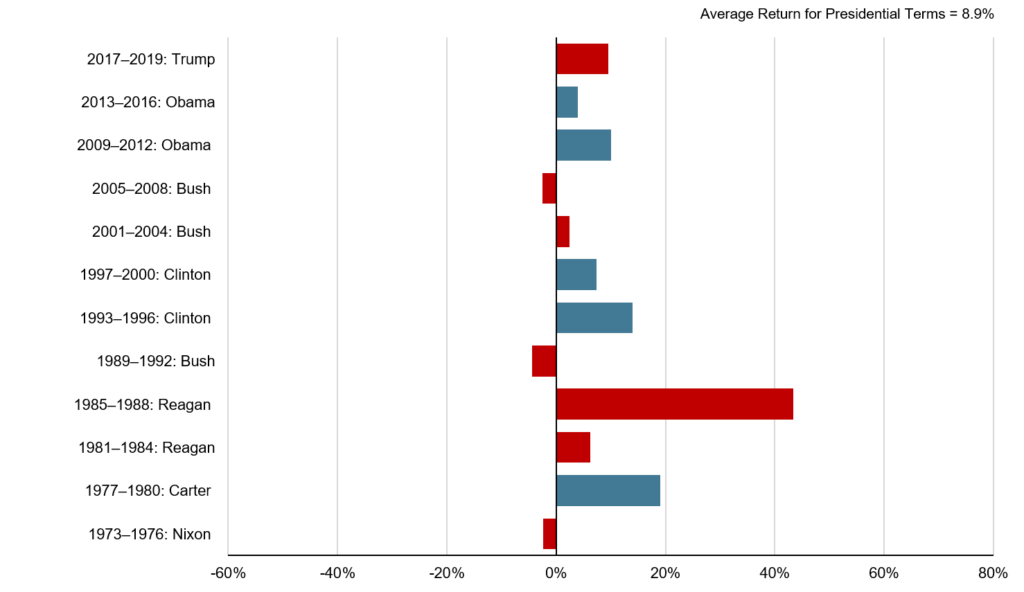
International developed stock market returns by president (annualized)
MSCI EAFE Index (net dividends)
The U.S. stock market isn’t the only game in town. In fact, the United States is roughly half of the global stock market. Investors who understand the value of diversifying in different asset classes may want to know the stock market performance by president for international developed markets, too.
Similar to the U.S. stock market, returns of global stocks depend on a multitude of factors. The U.S. plays a role in some events, such as trade policy with China, but has no part in others, like Brexit.
Source: Dimensional Fund Advisors
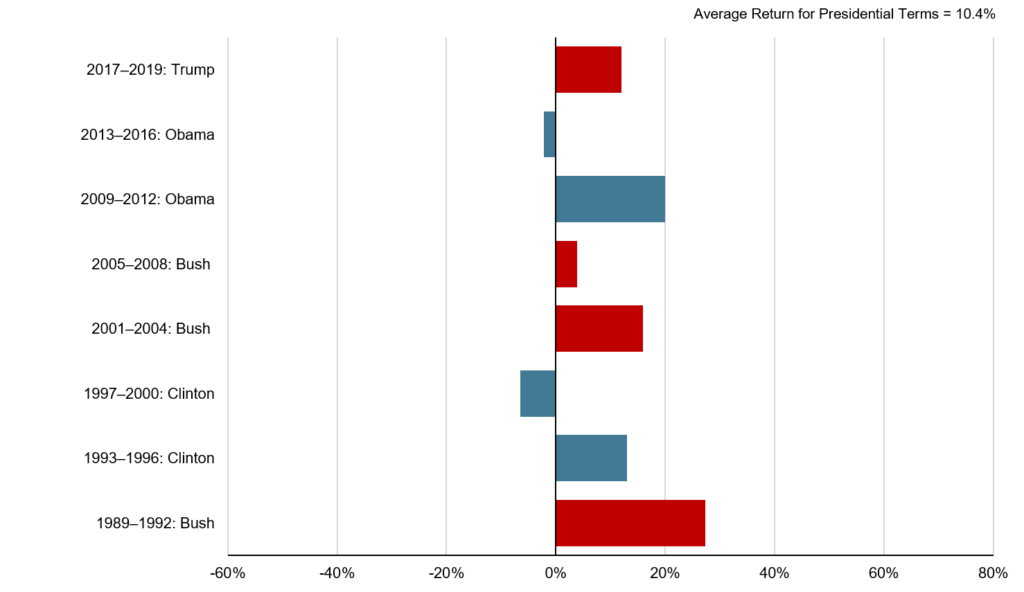
Emerging market equity performance by president (annualized)
MSCI Emerging Markets Index (gross dividends)
Emerging market economies can also be impacted, both directly and indirectly, by the U.S. presidential election and administration. Geopolitical tensions, trade policy, international relations, and the relative strength of the dollar are just a few factors.
Source: Dimensional Fund Advisors
You can’t blame the president for every crisis
Growth of a dollar—MSCI World Index (net dividends)
When trying to assess the stock market performance by president, trends are helpful, but the impact of uncontrollable events cannot be underestimated. Here’s how a dollar would grow in the global equity market from 1970 to 2019. Note the select headlines and differing market reactions.
Source: Dimensional Fund Advisors
Annualized bond returns during presidential terms
Bloomberg Barclays US Aggregate Bond Index
As expected, the volatility in the bond market is much less than equities. Since 1977, no president has had negative annualized fixed income returns over the course of their administration.
Just like the stock market, the president does not control the bond market, either. Monetary policy, interest rates, and inflation are key factors in driving bond returns. While the president has a say in shaping the Federal Reserve Board of Governors, the process involves a series of checks and balances , much like other aspects of our system. Interest rates have generally been declining since the 1980s.
Source: Dimensional Fund Advisors
How do the financial markets perform during election years?
The markets hate uncertainty more than bad news . A presidential election means the possibility for significant change. Historically, Republicans have valued lower taxes and less regulation (both of which the market likes), but as evidenced in earlier charts, that doesn’t necessarily translate to higher returns during an administration.
Investment returns during an election year are generally driven by a blend of factors. Here are some:
- Whether the incumbent president running for reelection
- Economic/geopolitical climate and expectations
- How close (and unpredictable) the election is
- Key issues of candidate and perceived threat to the stock market (e.g. higher taxes, repeal of business-friendly programs, increased regulation)
- Likelihood of one party controlling Congress after the election
Performance of stocks and bonds during election years
S&P 500 and Bloomberg Barclays US Aggregate Bond Index
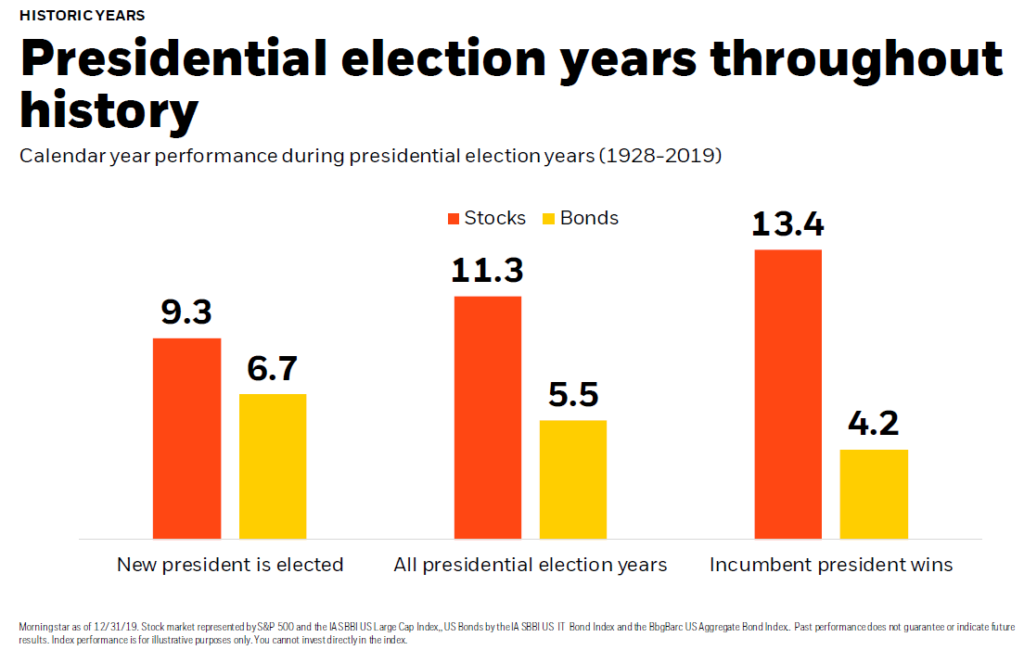
Source: BlackRock
Closer look: stock and bond returns during an election year versus the year after
U.S. stocks (S&P 500 Index)
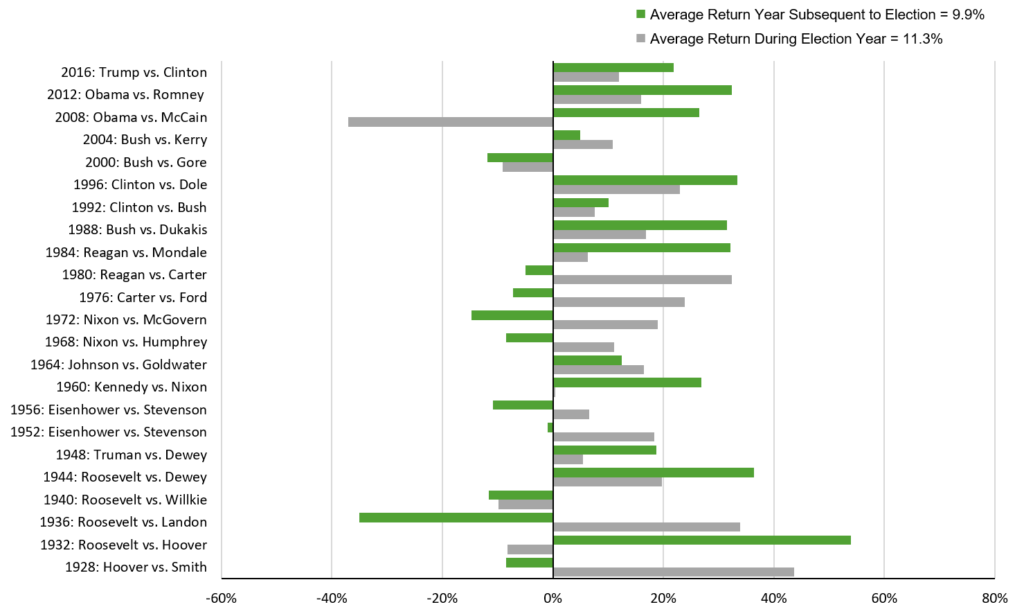
U.S. bonds (Bloomberg Barclays US Aggregate Bond Index)
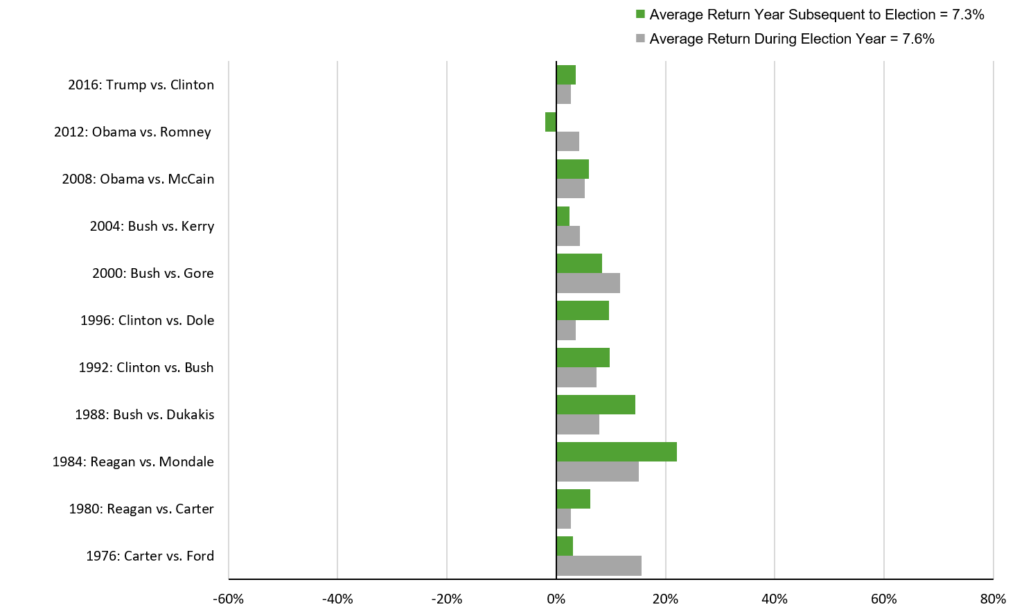
Source: Dimensional Fund Advisors
International developed equity (MSCI EAFE Index (net dividends))
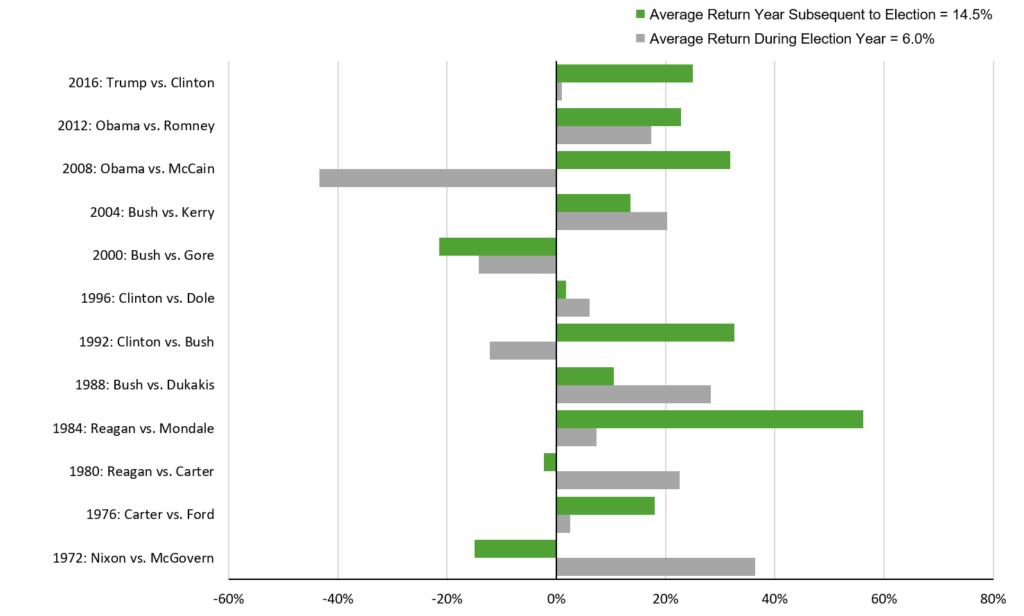
Source: Dimensional Fund Advisors
Emerging market equity (MSCI Emerging Markets Index (gross dividends))
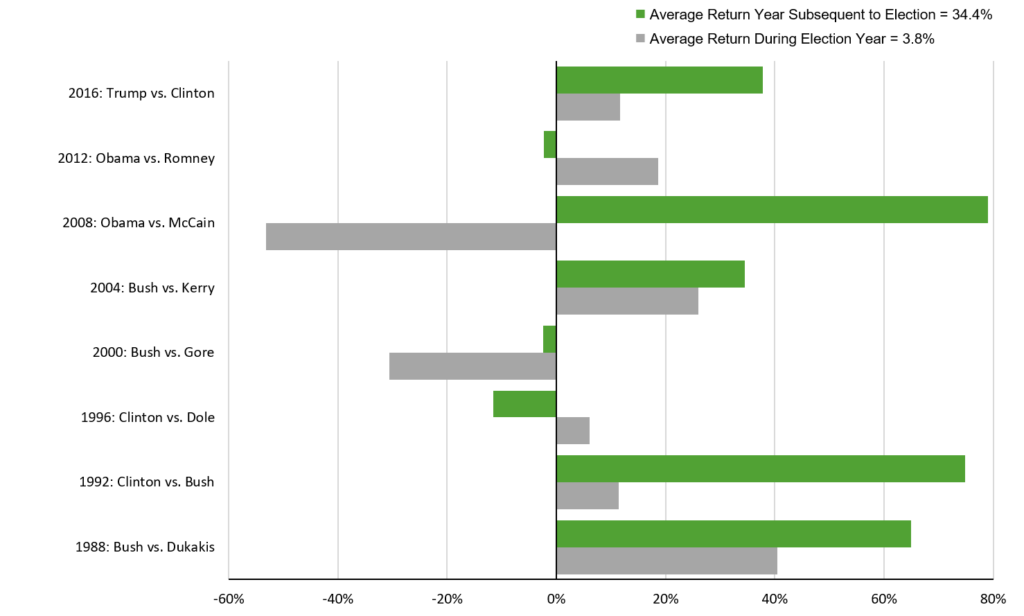
Source: Dimensional Fund Advisors
U.S. stock market performance during Democratic, Republican, and mixed party control of Congress
Hypothetical Growth of $1 Invested in the S&P 500
Mixed control of the House and the Senate means more roadblocks to either party’s agenda. This leads to slower change or no change at all. Since the markets are afraid of uncertainty, the status quo might be welcome news. The chart below shows how relatively infrequently there’s a mixed Congress. In either case, it’s impossible to identify any trends when zooming out and looking at the bigger picture over time, as long-term investors should. The stock market is not the economy or the White House for that matter.
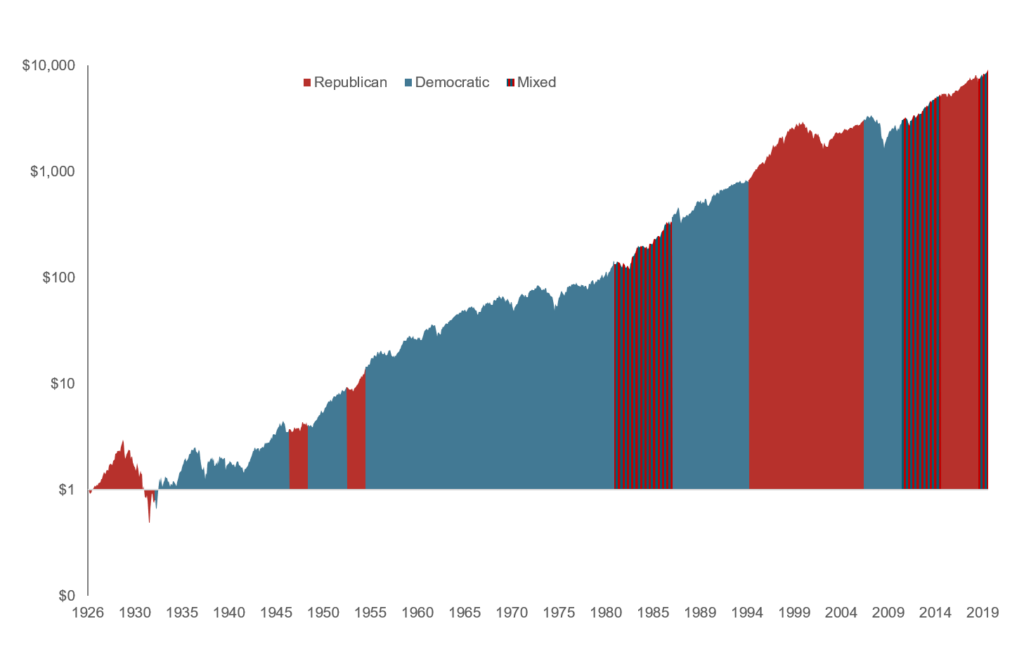
Source: Dimensional Fund Advisors
How to manage your investments during an election year
Should you make changes to your asset allocation during an election year or after a new president is elected? Probably not. Focusing on what you can control is key when investing for the long-term. Even if the market is caught off-guard by the election results (as evidenced in 2016 when President Trump won), the shock may be temporary. The stock market has a really bad memory! By design, headlines will always try to paint an extreme picture. It can be hard, but it’s really important not to allow personal feelings about politics interfere with your financial plan.
Past performance is not a guarantee of future results. Indices are not available for direct investment; therefore, their performance does not reflect the expenses associated with the management of an actual portfolio. This article is for generalized information only and should not be misconstrued as the rendering of personalized investment advice.
The post Stock Market Performance by President (in Charts) appeared first on Darrow Wealth Managment .
RSS Import: Original Source